How to include trending data in the turnover report
Included with the standard Turnover Report is the ability to run a turnover report that shows headcount trends over a number of years. This comes in handy for tracking trends within departments over time.
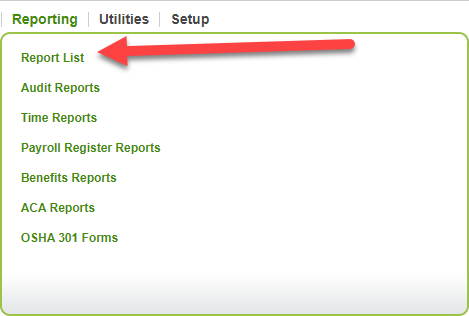
To do this, to the Report List from the Reporting tab.
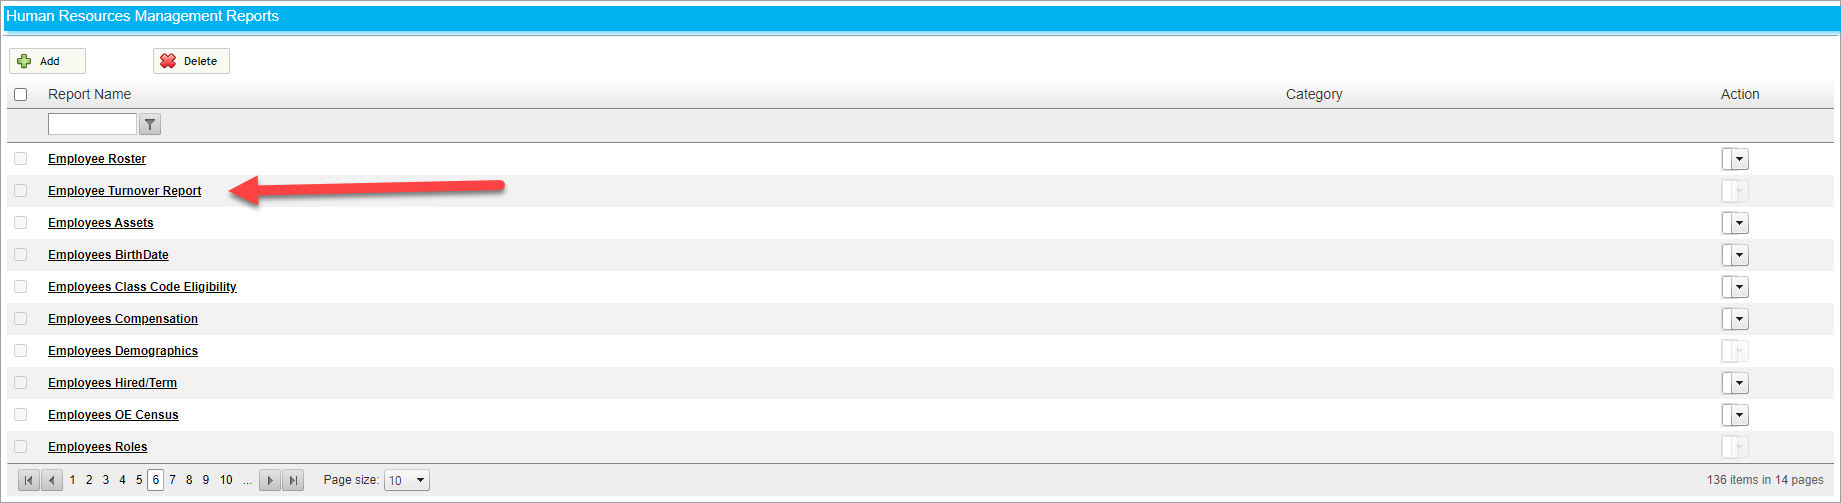
Then click on Employee Turnover Report.
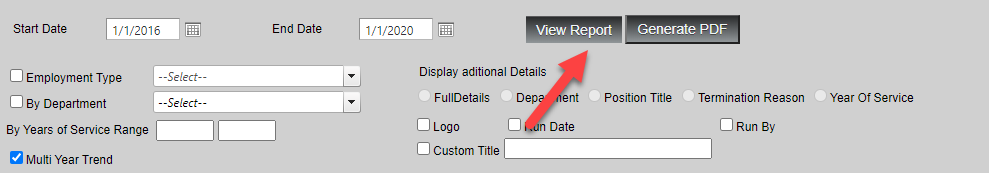
To see trending data, choose a date range and select the Multi-Year Trend button.
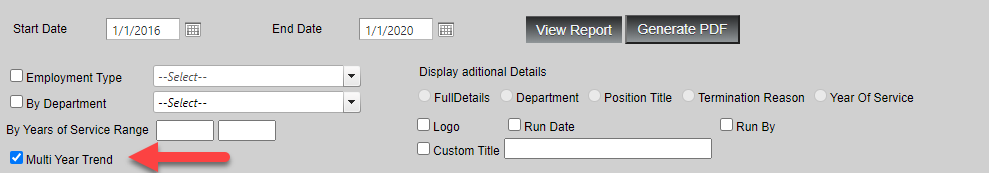
For the multi-year function to work, the date range must have the same start and end month and day. In the above screenshot, you can see I selected January 1st in 2016 and 2020. Not following this will result in an error message.
Then click View Report.
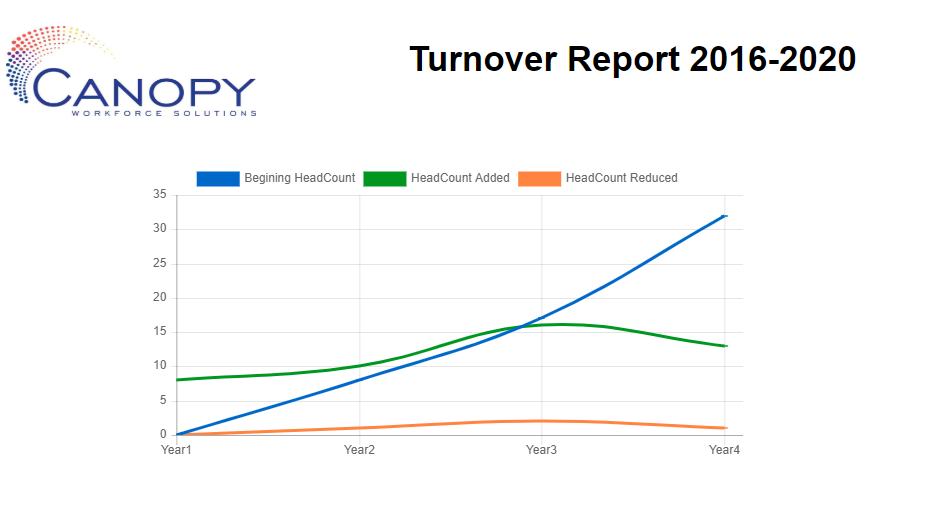
The resulting graph will display headcount trends over the selected time period. In this example, I also chose to include a custom title and logo.