
Group data to make it easier to read
After creating and filtering our new, lovely report, why don’t we analyze it? The analysis tool will let us fine-tune how the filtered data is displayed.
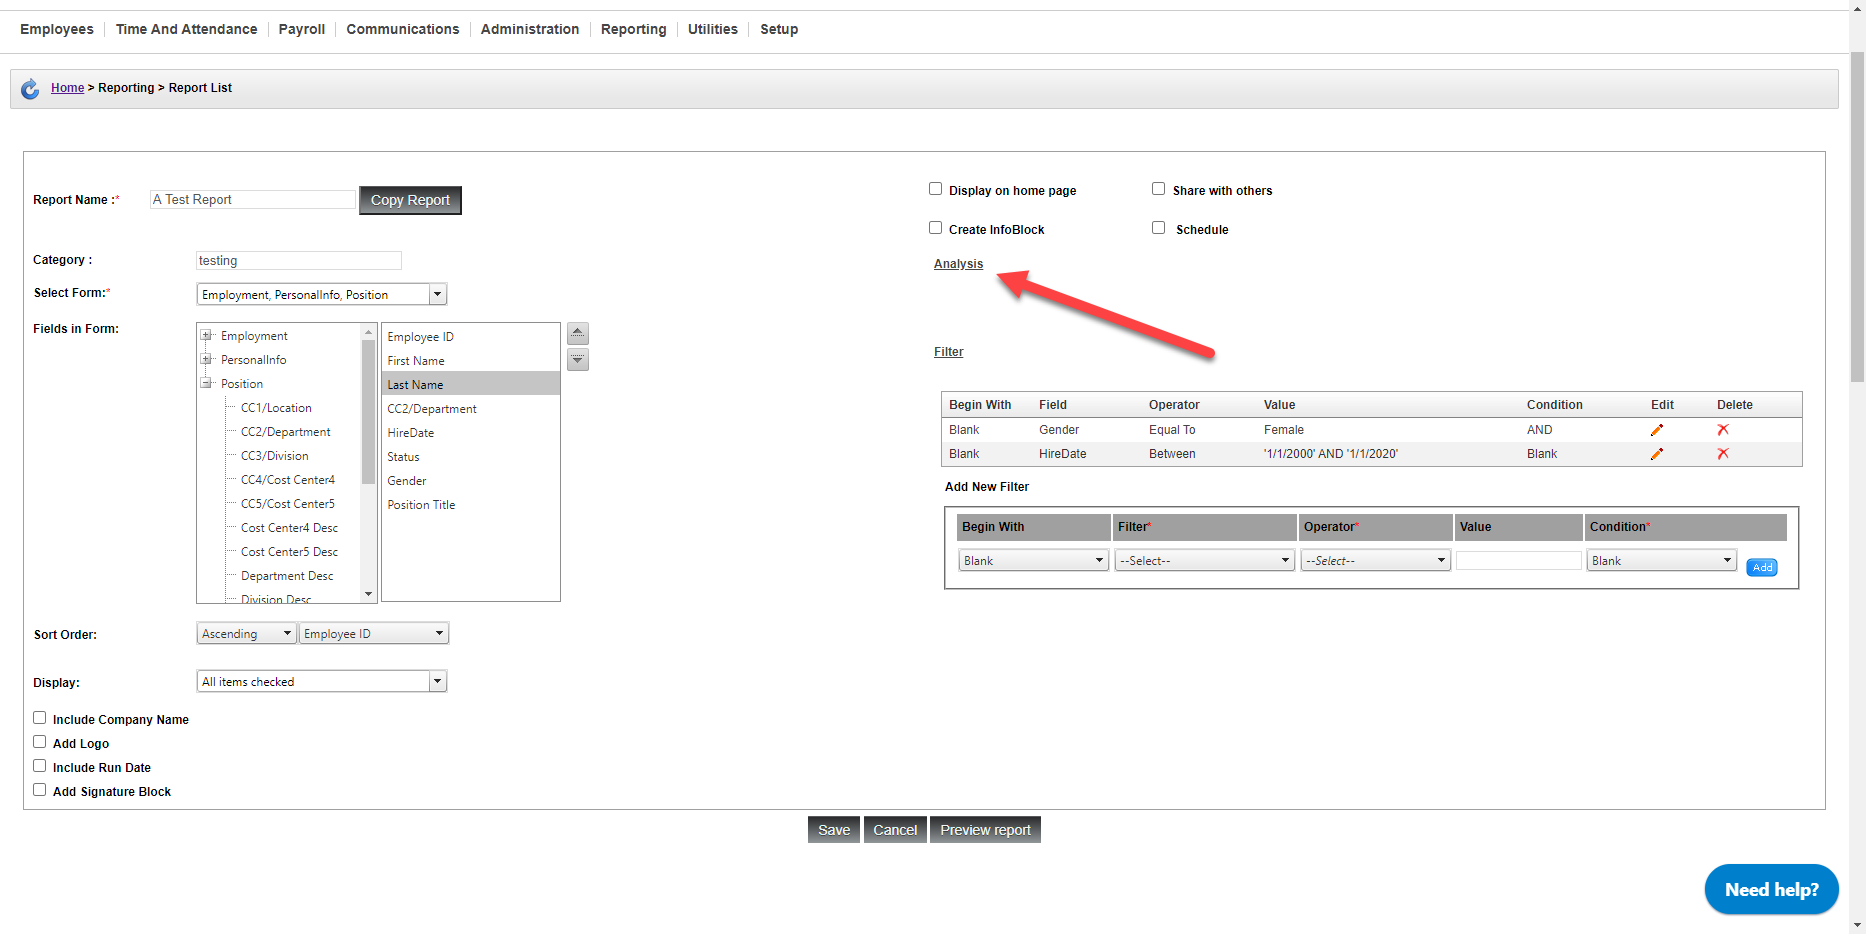
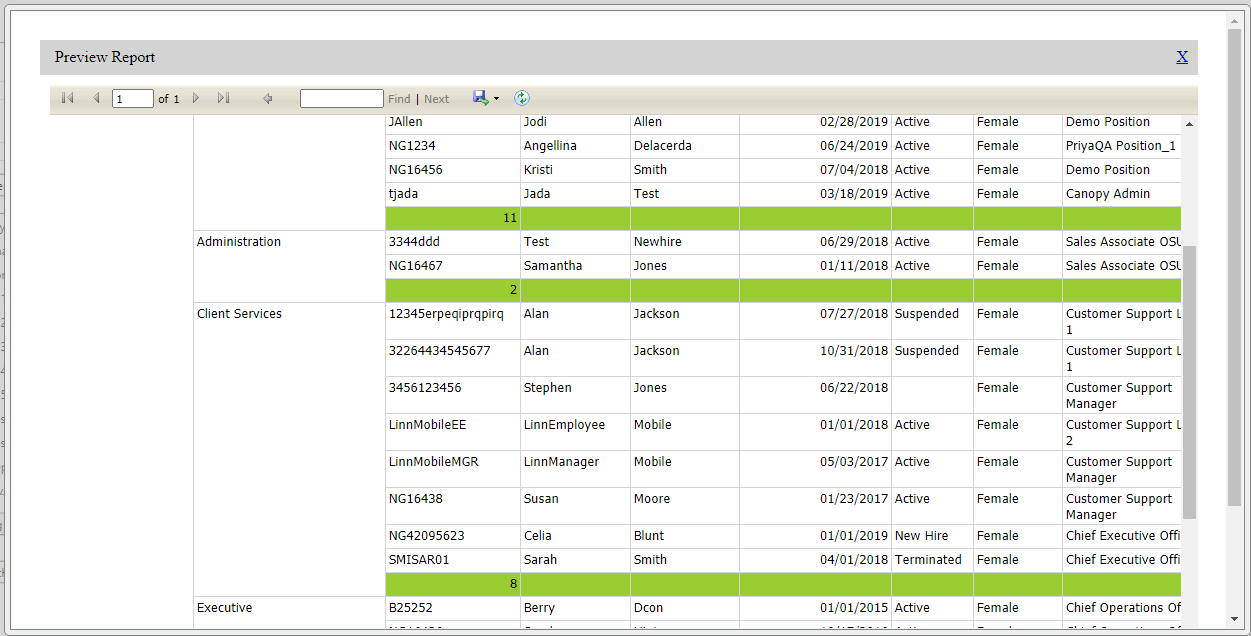
For reference, this is our current report on females hired from 1/1/2000 to 1/1/2020.
Let’s say we want to organize our data to see the number hired in each department.
Instructions
From the report writer:
-
Click the Analysis button.
-
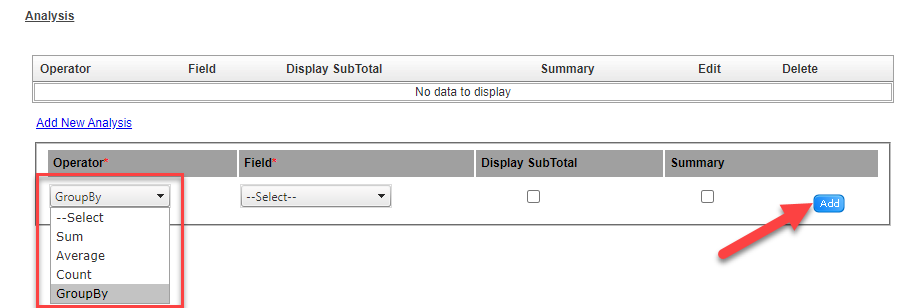
For this example, we are going to choose GroupBy and choose the CC2/Department field. Make sure to click the Add button to include the analysis.
-
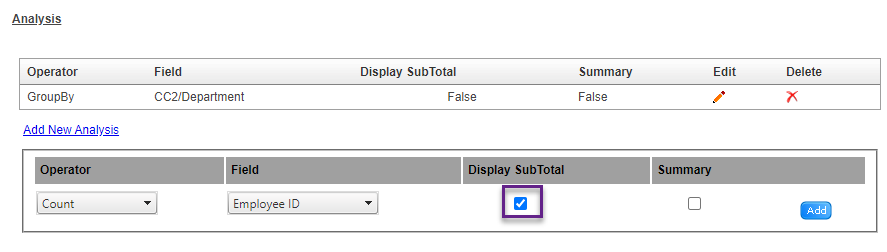
We will add another analysis that counts the employee ID field. In this case, we are going to check the Display SubTotal box so the count appears on the report.
-
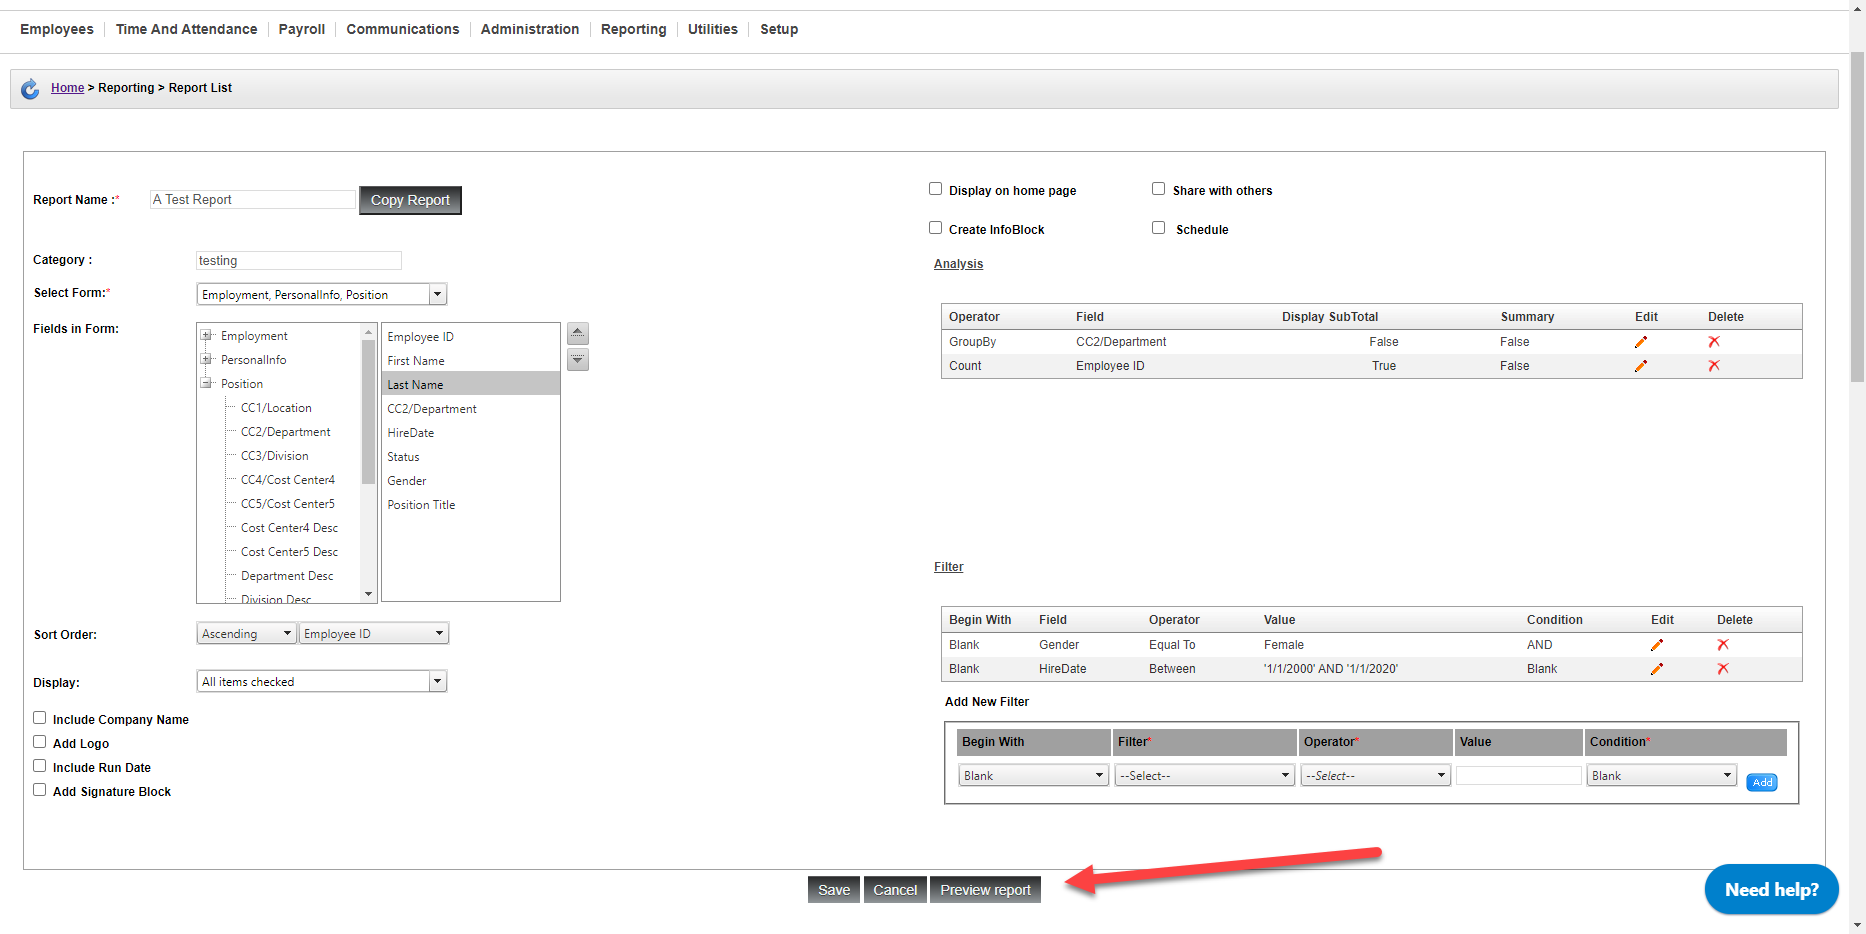
Click Save, or Preview the report prior to saving.
Now our report will be grouped by department, and show a count of the number of female new hires from each department in green!
You do not need to have filtered data to run an analysis. It just helps!